![]()
Awards by Sponsor Type '24-25
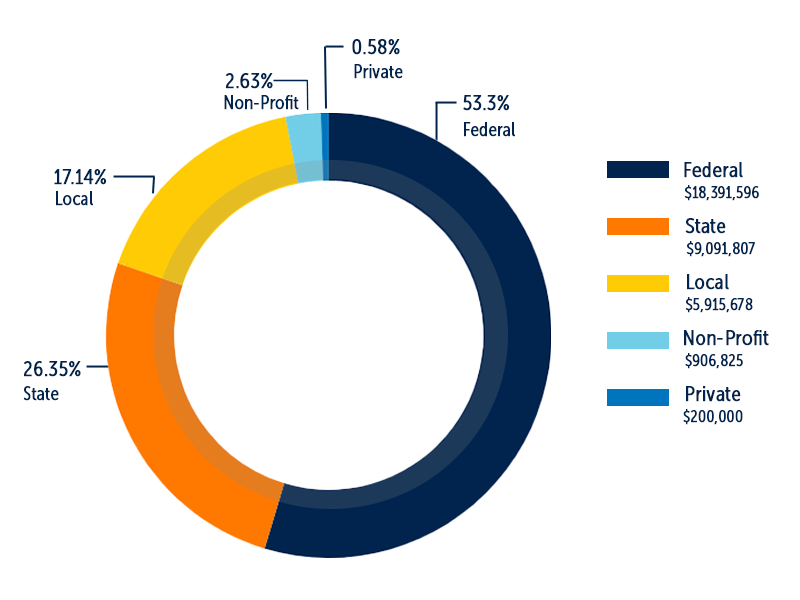
2024-2025 Extramural Awards by Sponsor Type
Federal | $18,391,596 (53.3%)
State | $9,091,807 (26.35%)
Local | $5,915,678 (17.14%)
Non-Profit | $906,825 (2.63%)
Private | $200,000 (0.58%)
Awards by College/Division
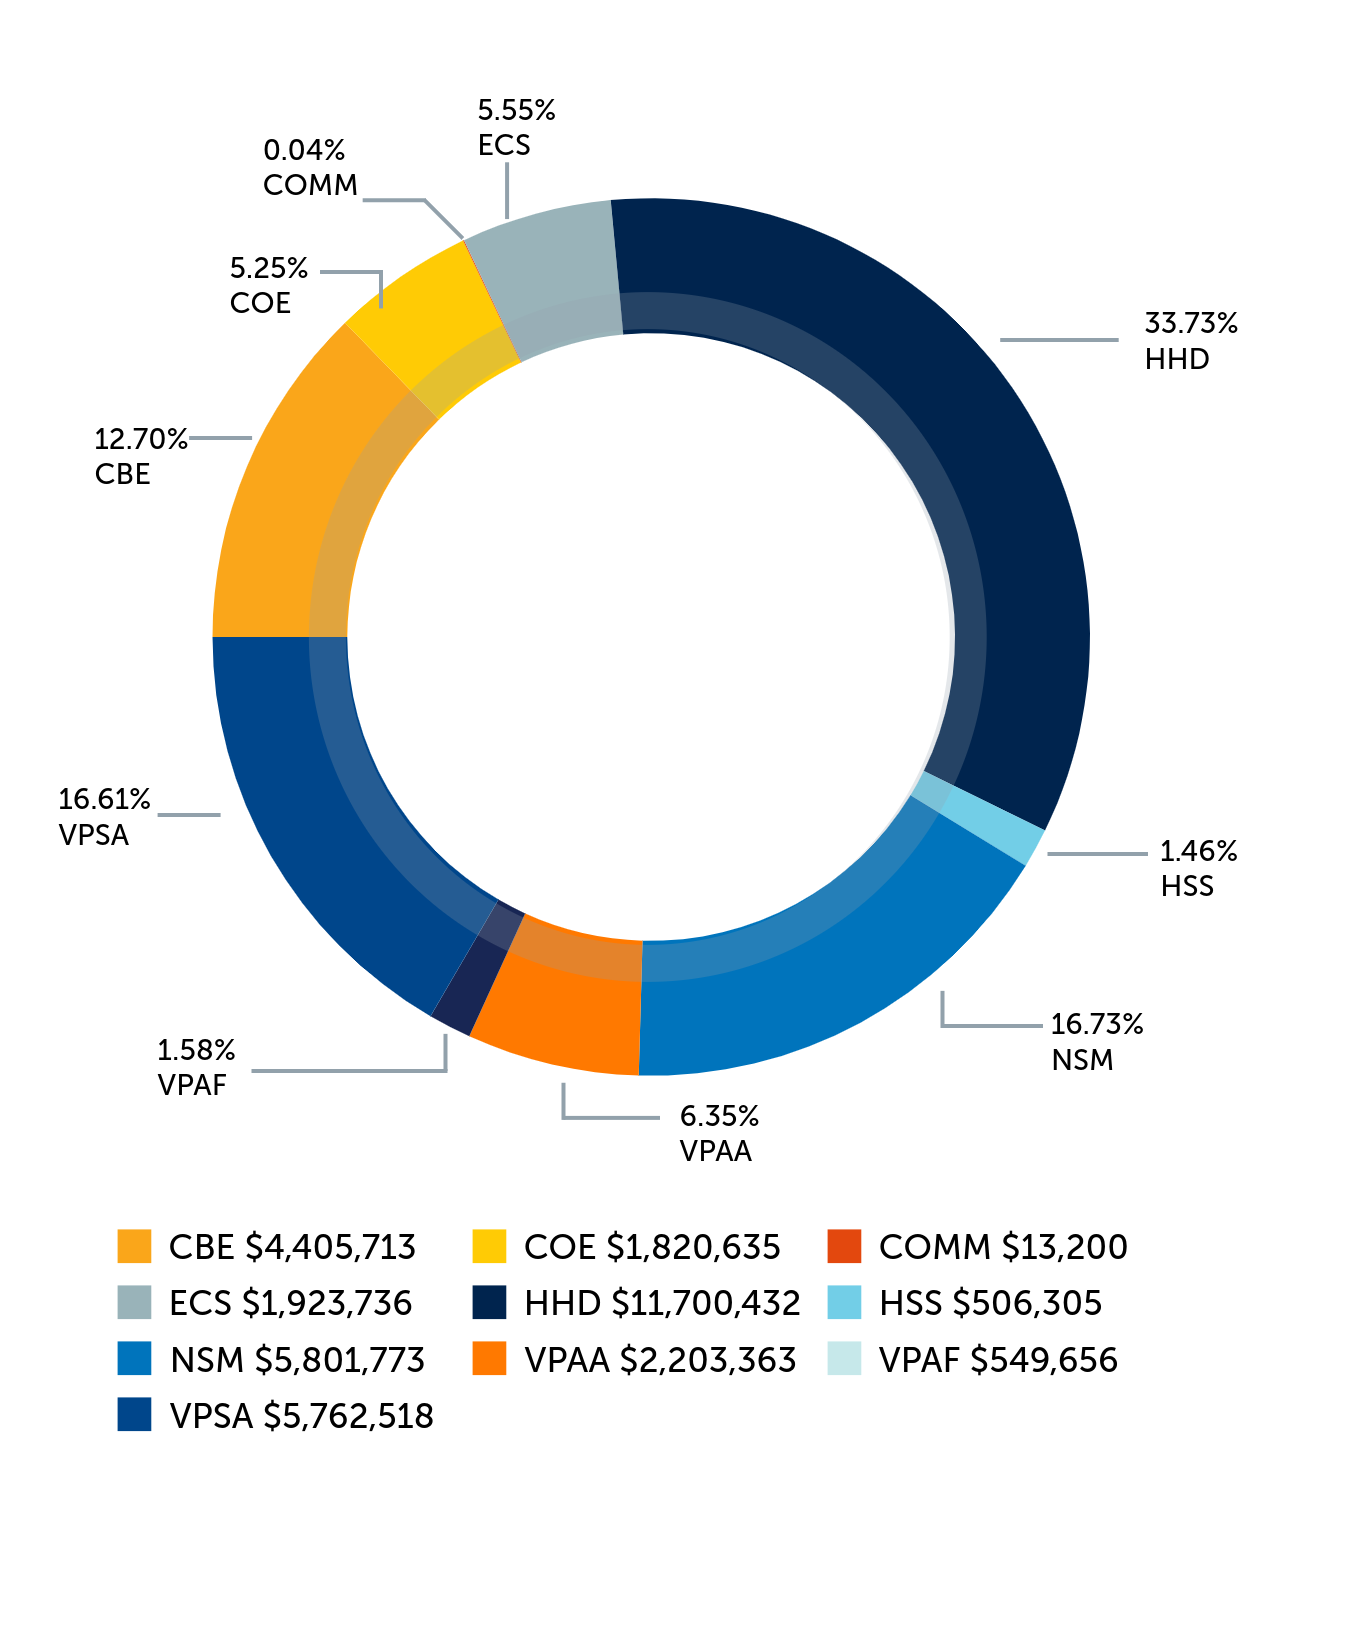
2024-2025 Extramural Awards by College/Division
CBE | $4,405,713.00 (12.70%)
COE | $1,820,635.00 (5.25%)
COMM | $13,200.00 (0.04%)
ECS | $1,923,736.00 (5.55%)
HHD | $11,700,432.42 (33.73%)
HSS | $506,305.00 (1.46%)
NSM | $5,801,772.98 (16.73%)
VPAA | $2,203,363.16 (6.35%)
VPAF | $549,656.00 (1.58%)
VPSA | $5,762,518.00 (16.61%)
External Awards (since 2018)
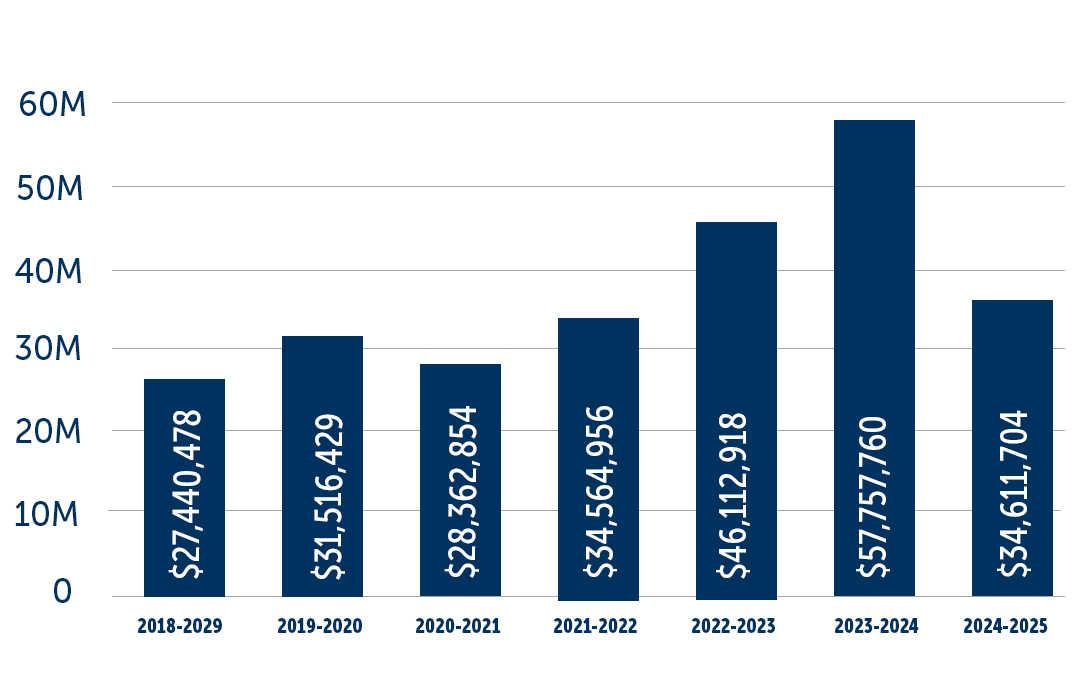
Seven Year Totals: Extramural Awards
$34,611,704 (FY 2024-2025)
$57,757,760 (FY 2023-2024)
$46,112,918 (FY 2022-2023)
$34,564,956 (FY 2021-2022)
$28,362,854 (FY 2020-2021)
$31,516,429 (FY 2019-2020)
$27,440,478 (FY 2018-2019)
Awards by College/Division (since 2018)
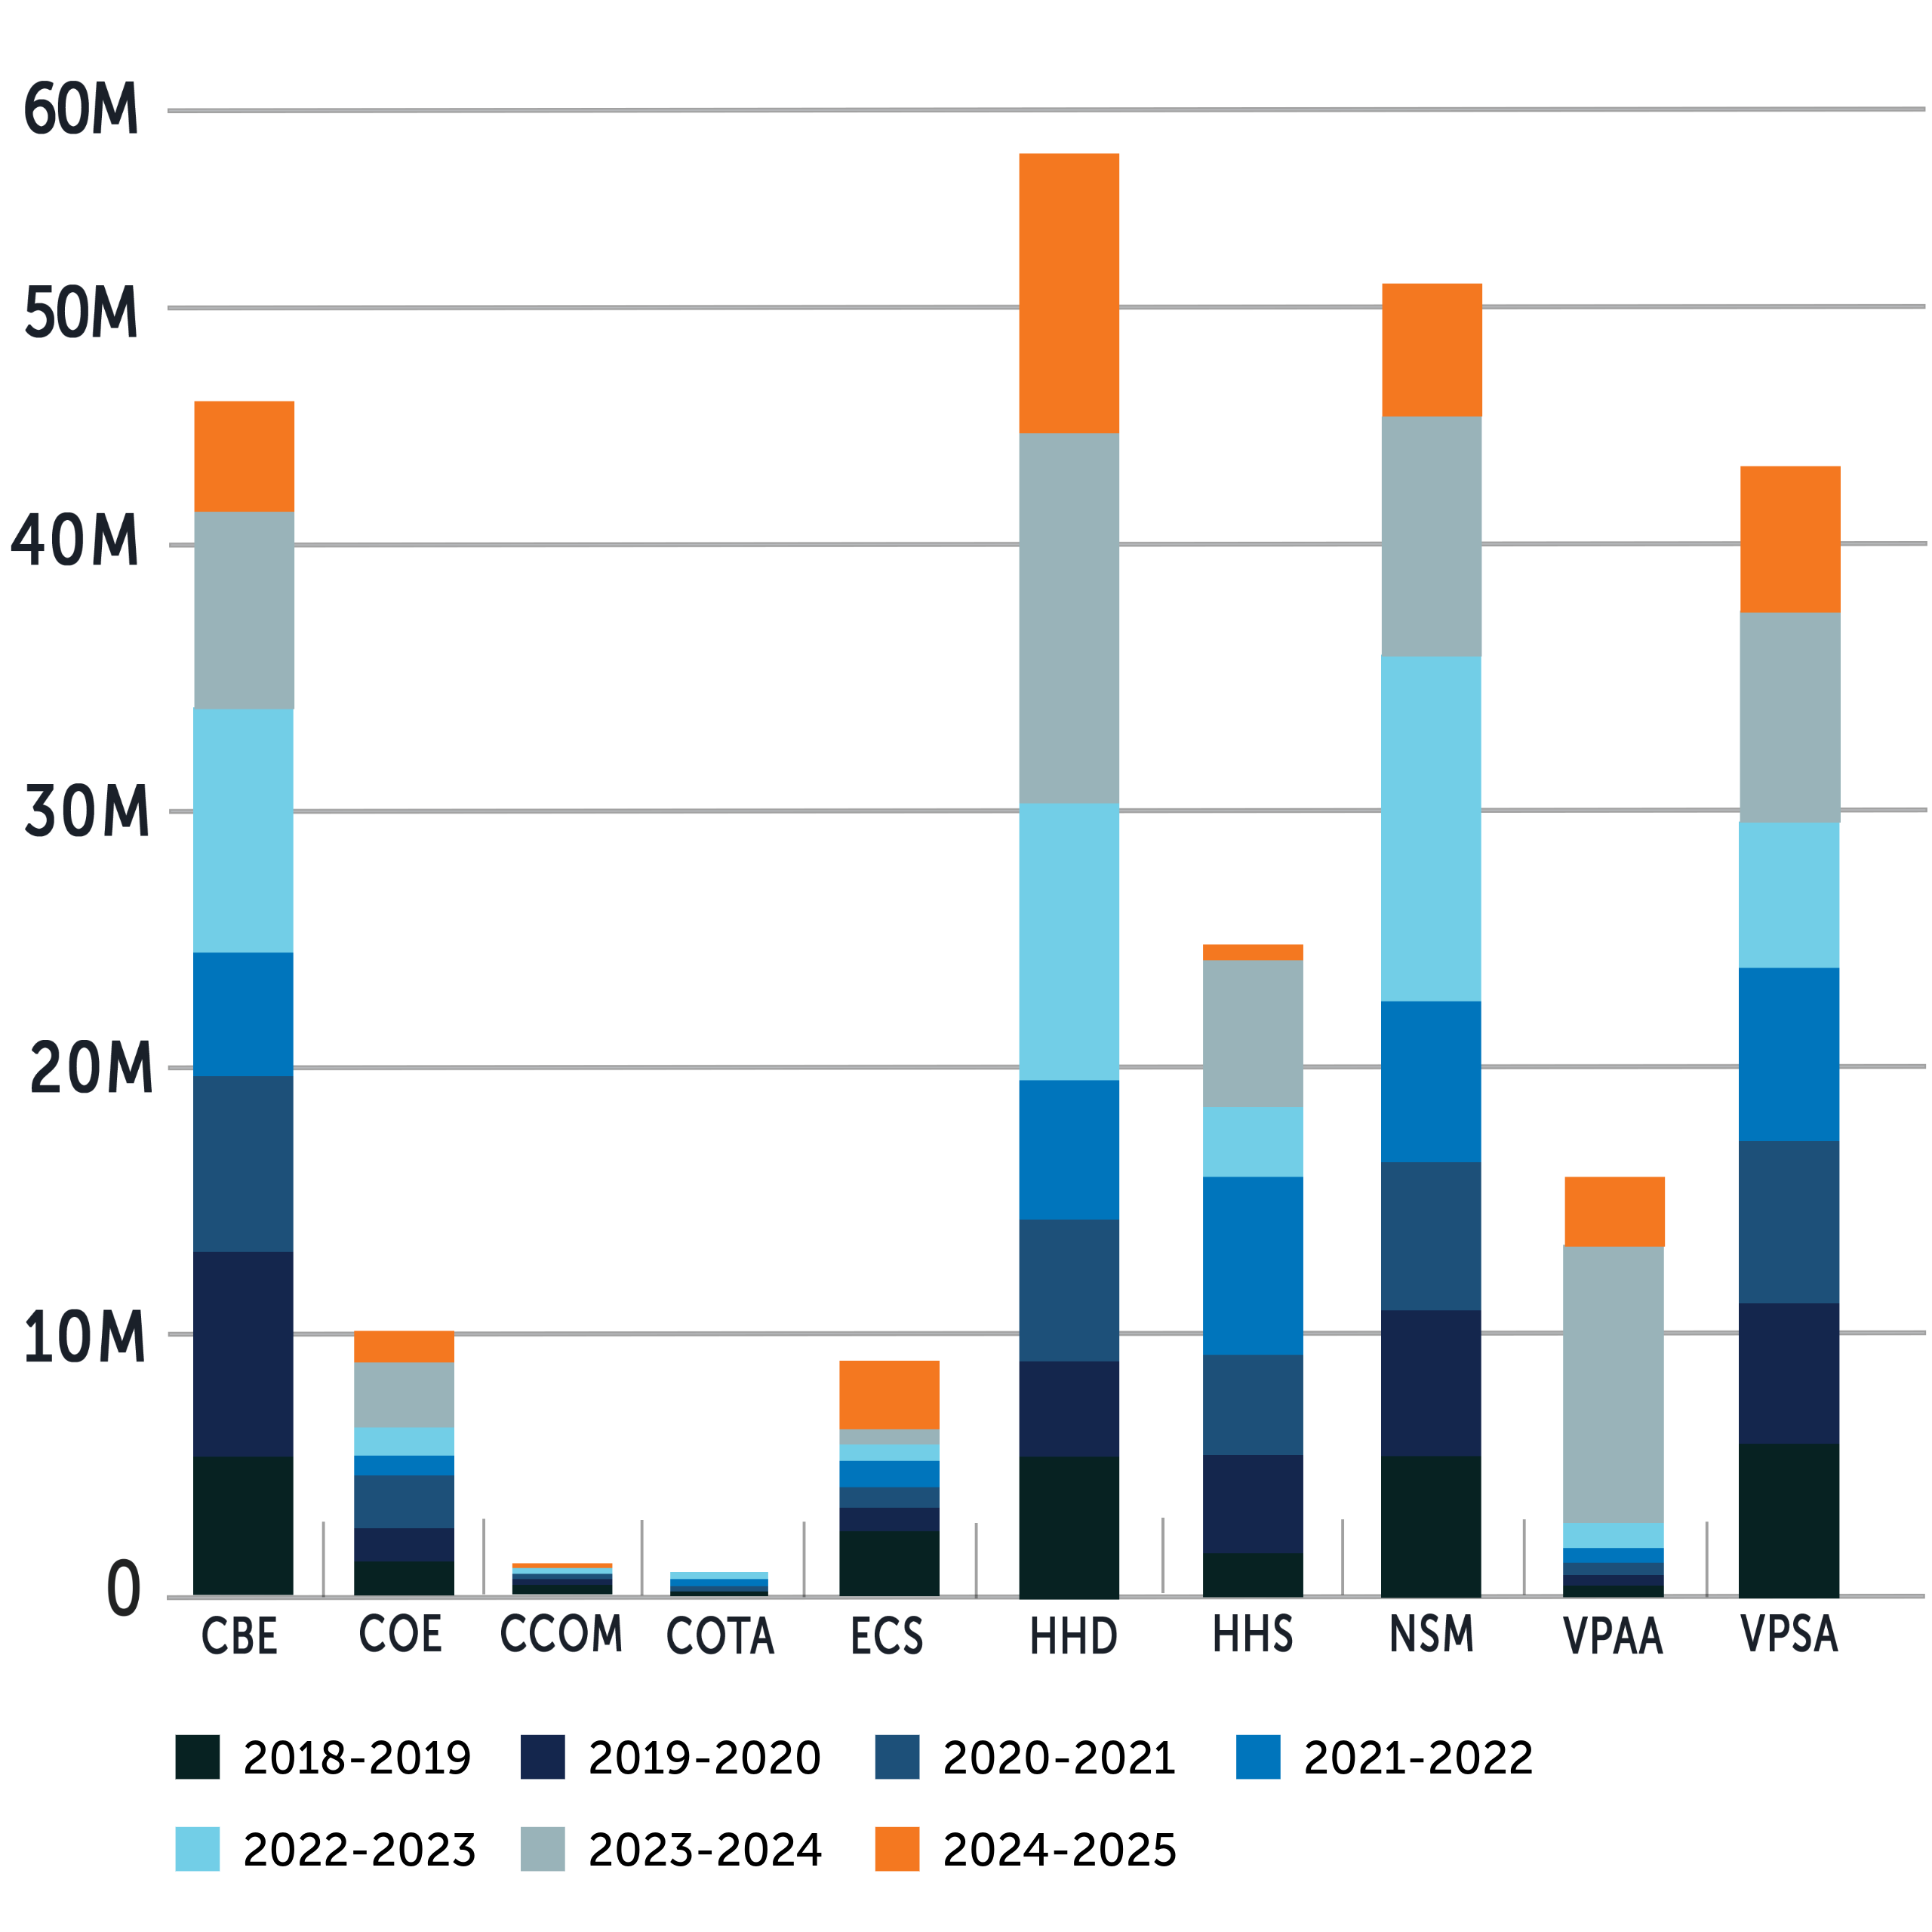
Seven Year Totals: Awards by College/Division
CBE | $46,314,238
COE | $10,364,113
COMM | $109,468
ECS | $8,807,047
HHD | $57,519,924
HSS | $24,205,619
NSM | $51,173,800
VPAA | $15,750,261
VPSA | $43,347,082
Expenditures (since 2018)
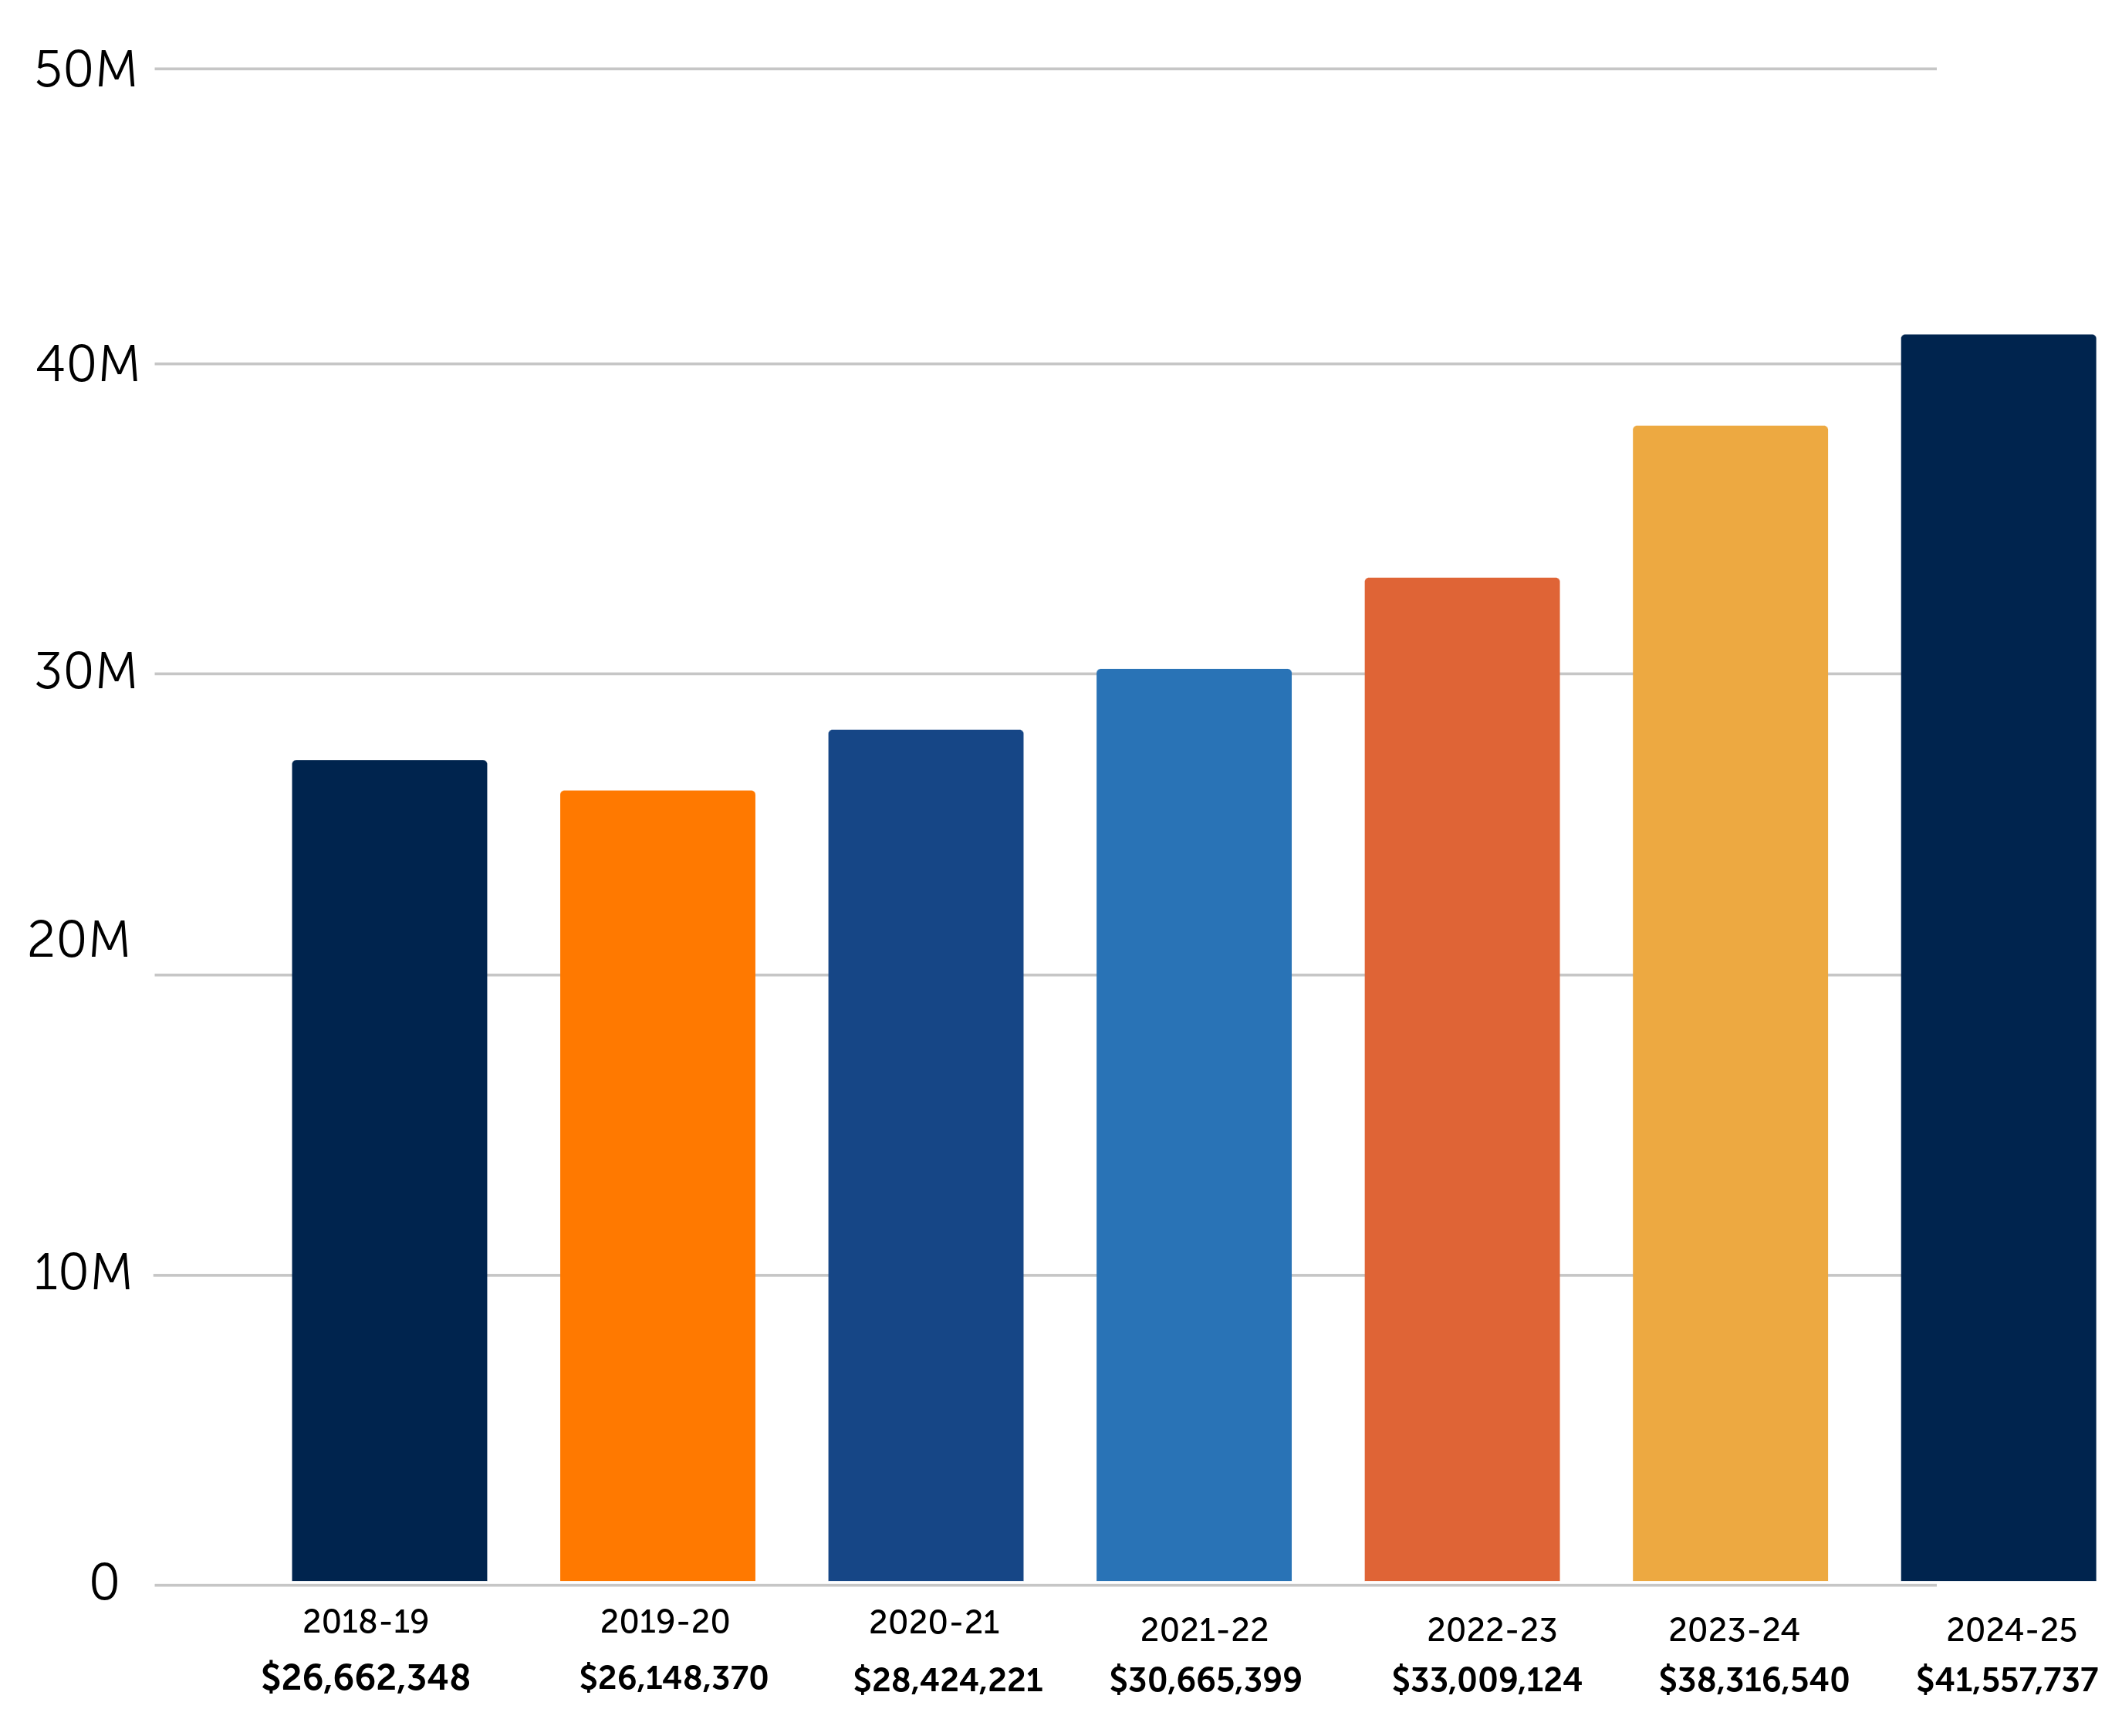
Seven Year Totals: Expenditures
$41,557,737 | FY 2024-25
$38,316,540 | FY 2023-24
$33,009,124 | FY 2022-23
$30,665,399 | FY 2021-22
$28,424,221 | FY 2020-21
$26,148,370 | FY 2019-20
$26,662,348 | FY 2018-19
NSF Herd Survey R&D Expenditures
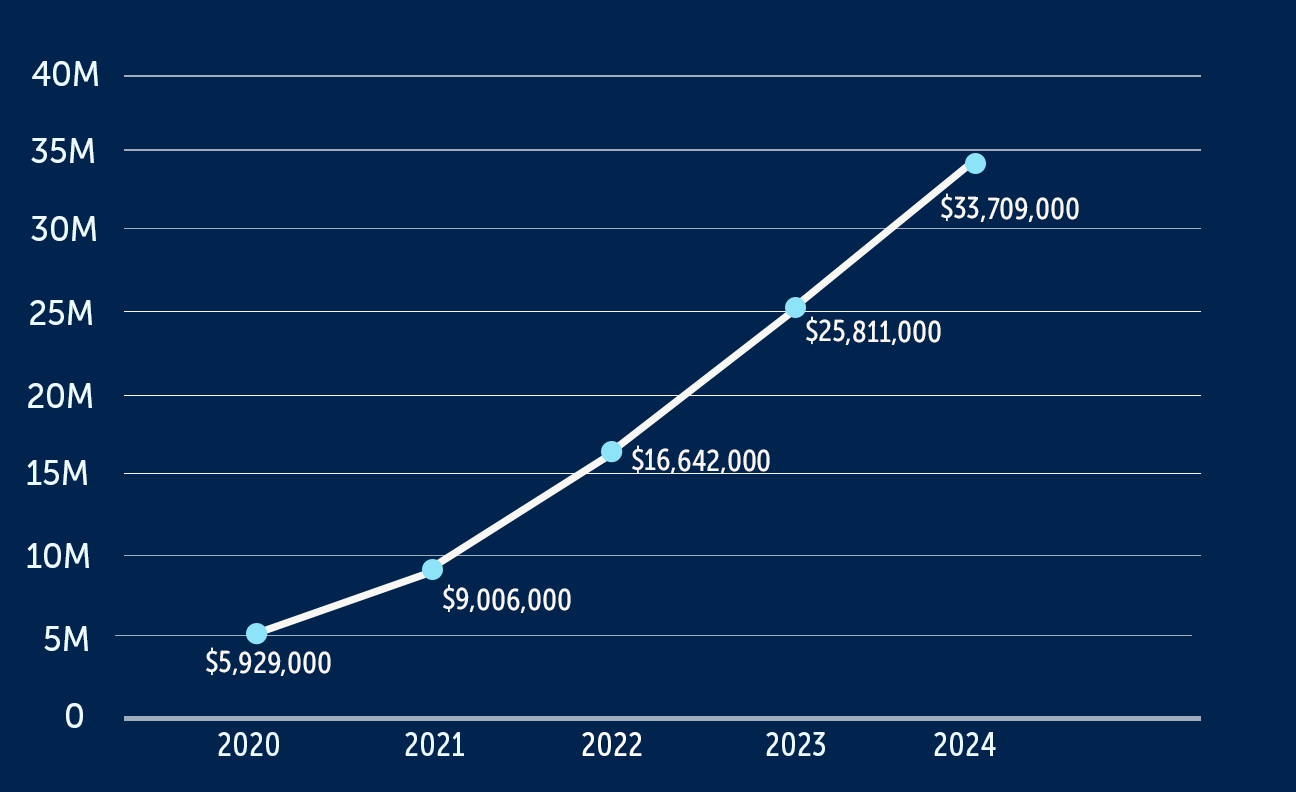 Five Year Totals: NSF Herd Survey R&D Expenditures*
$33,709,000 (2024)
$25,811,000 (2023)
$16,642,000 (2022)
$9,006,000 (2021)
$5,929,000 (2020)
*Data show research and development (R&D) expenditures reported in the NSF Higher Education Research and Development (HERD) Survey.
![]()
Students Employed
- 717
- students supported by awards
- $4.3 m
- student wages
![]()
Staff Employed
- 576
- staff supported by awards
- $9.7 m
- staff wages
![]()
Faculty Paid
- 390
- Faculty supported by awards
- $3.2 m
- wages to support faculty
Submissions by Sponsor Type (2024-2025)
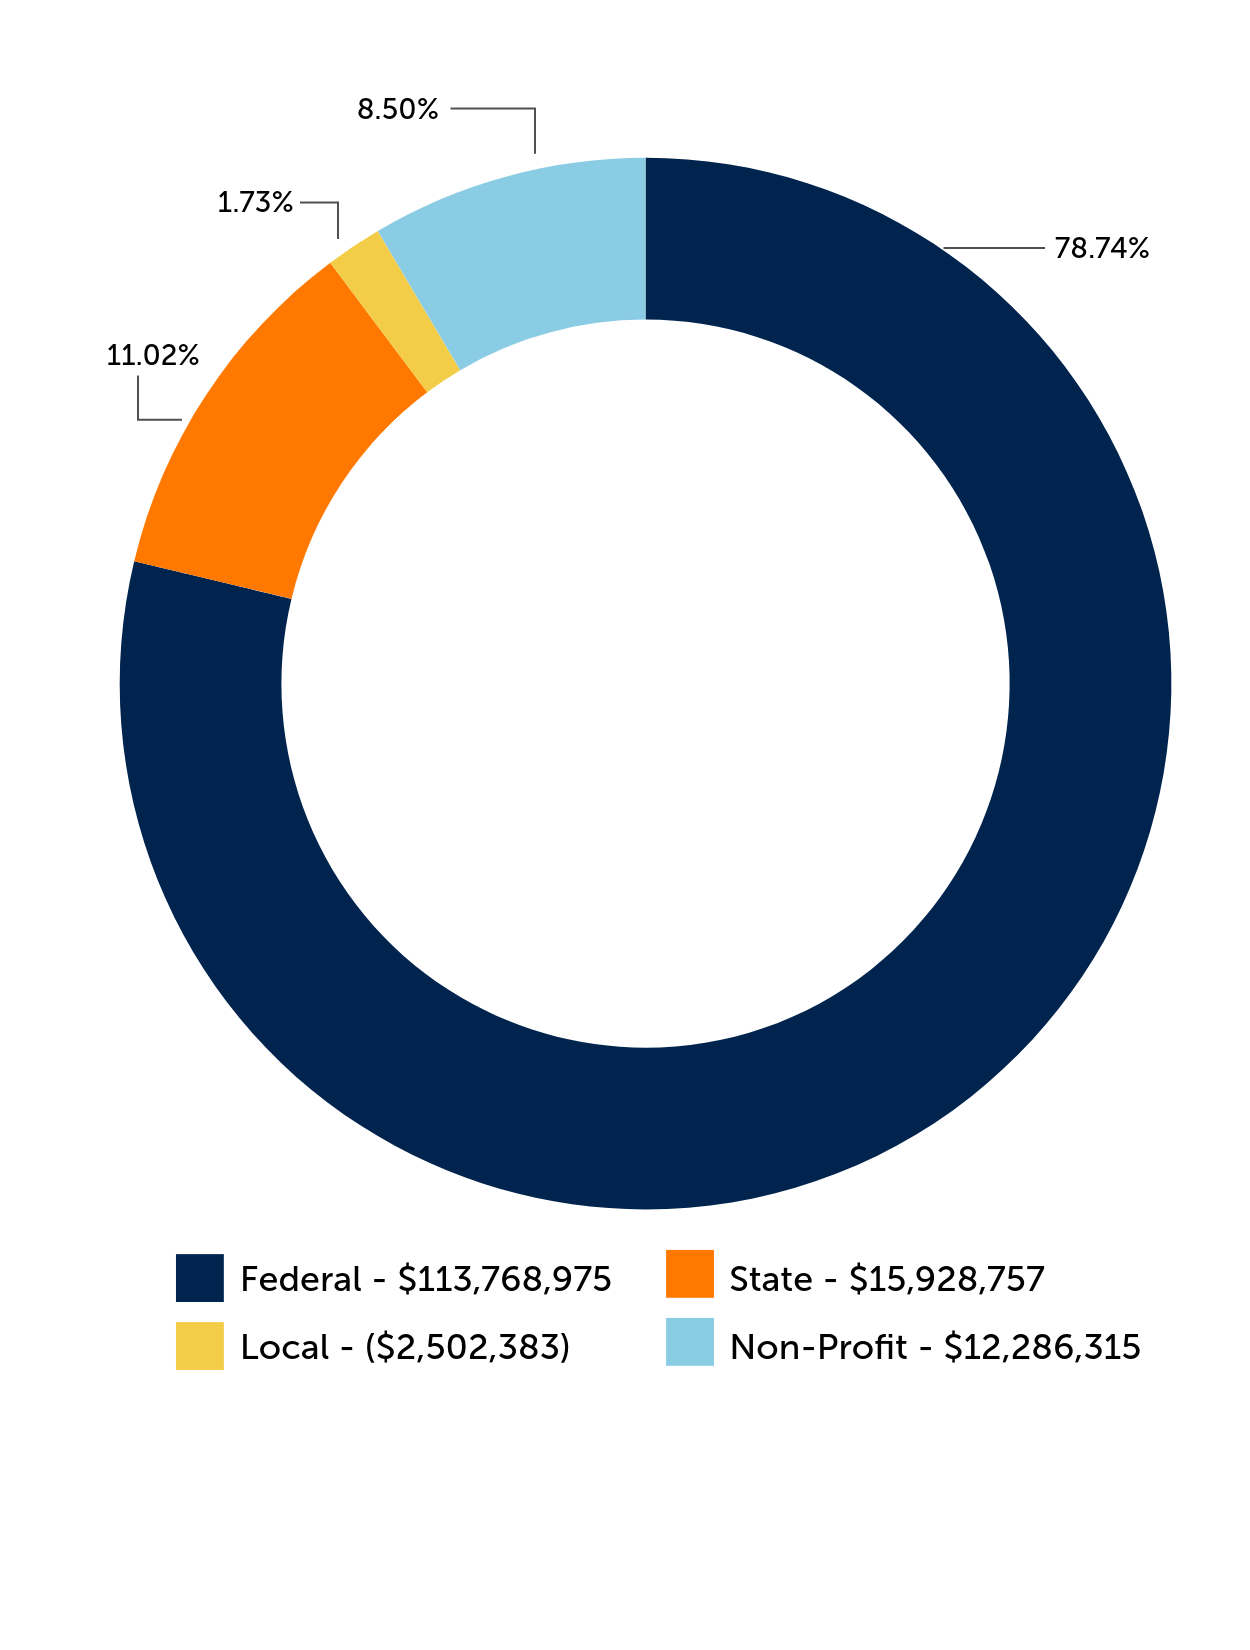 2024-2025 Submissions by Sponsor Type
Federal | $113,768,975 (78.74%)
State | $15,928,757 (11.02%)
Local | $2,502,383 (1.73%)
Non-Profit | $12,286,315 (8.5%)
Submissions by College/Division (2024-2025)
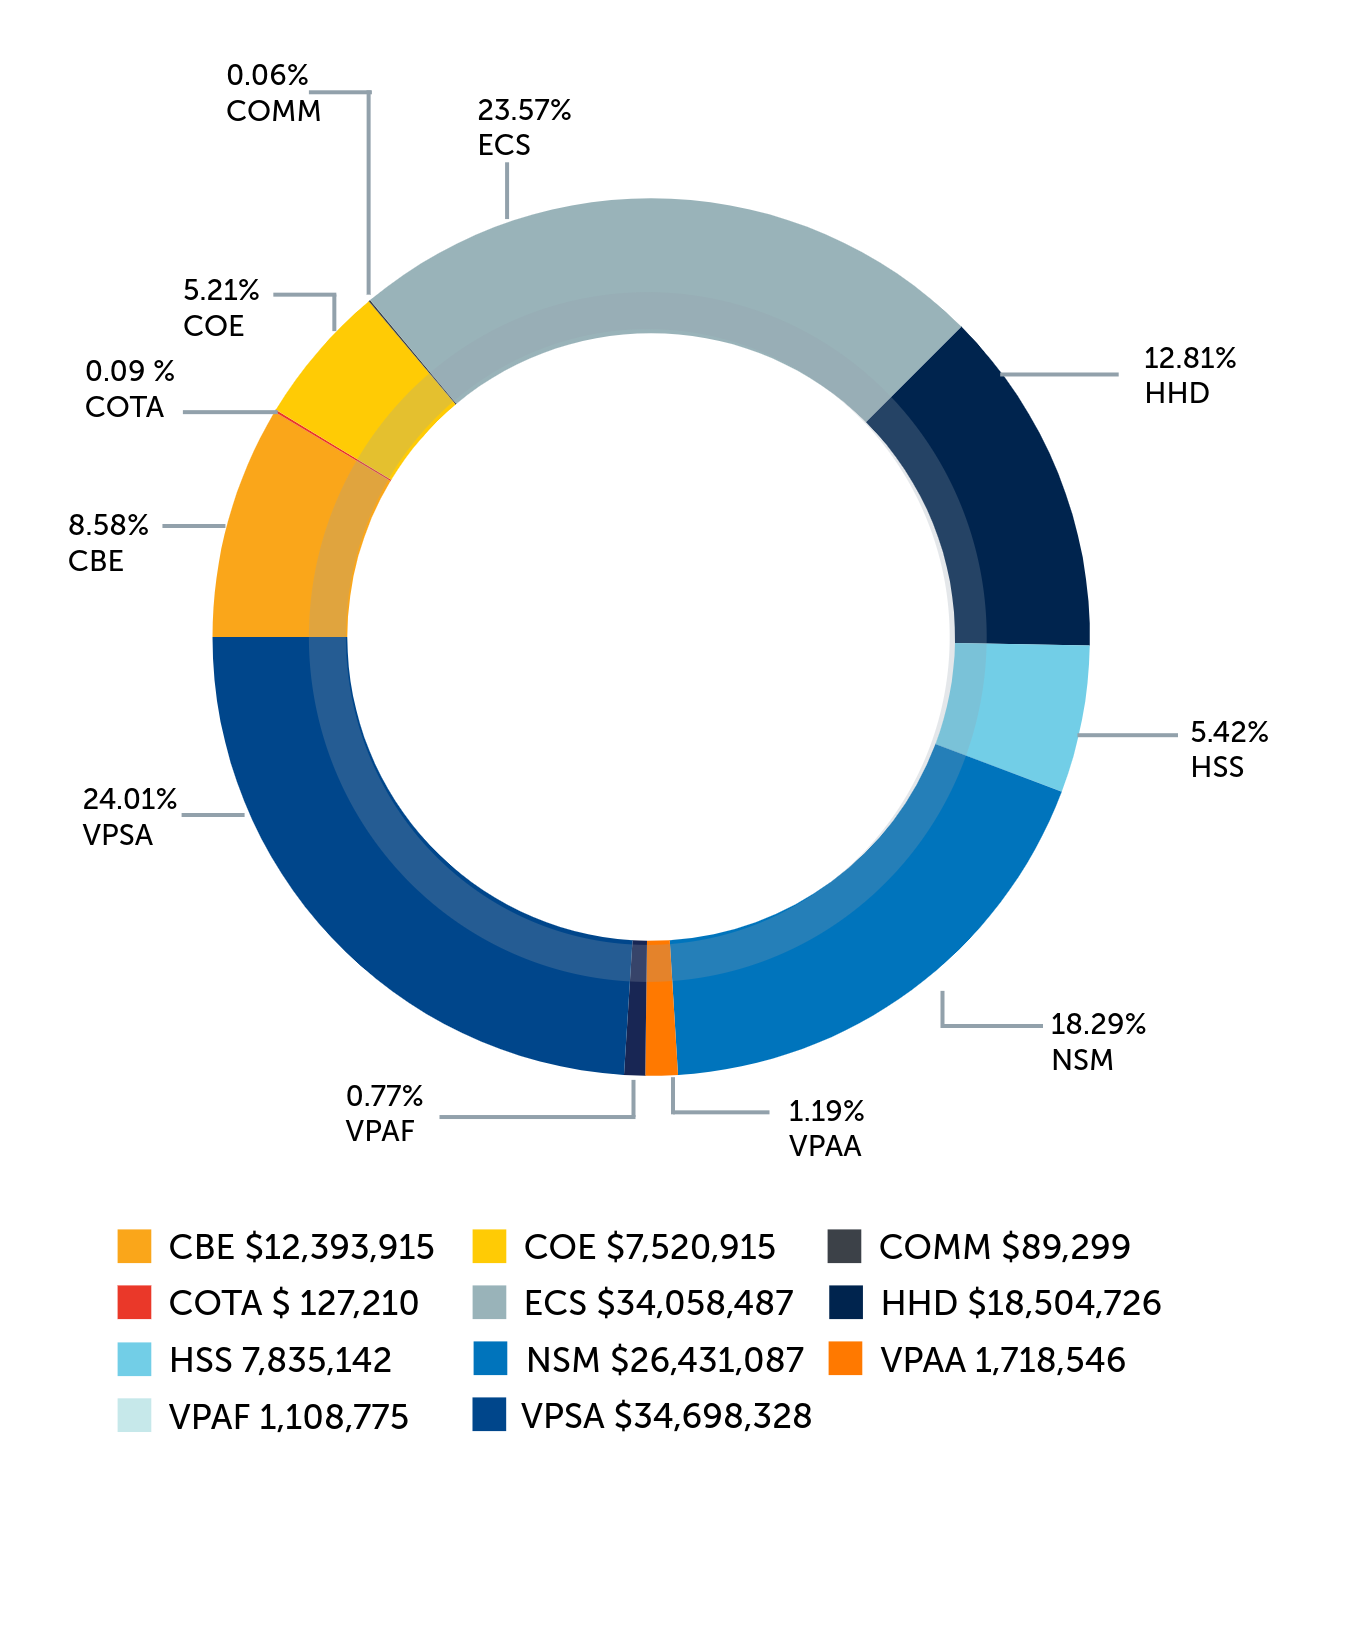 2024-2025 Submissions by College/Division
CBE | $12,393,915 (8.58%)
COE | $7,520,915 (5.21%)
COMM | $89,299 (0.06%)
COTA | $127,210 (0.09%)
ECS | $34,058,487 (23.57%)
HHD | $18,504,726 (12.81%)
HSS | $7,835,142 (5.42%)
NSM | $26,431,087 (18.29%)
VPAA | $1,663,546 (1.19%)
VPAF | $1,108,775 (0.77%)
VPSA | $34,698,328 (24.01%)
Multi-Year Submissions (since 2018)
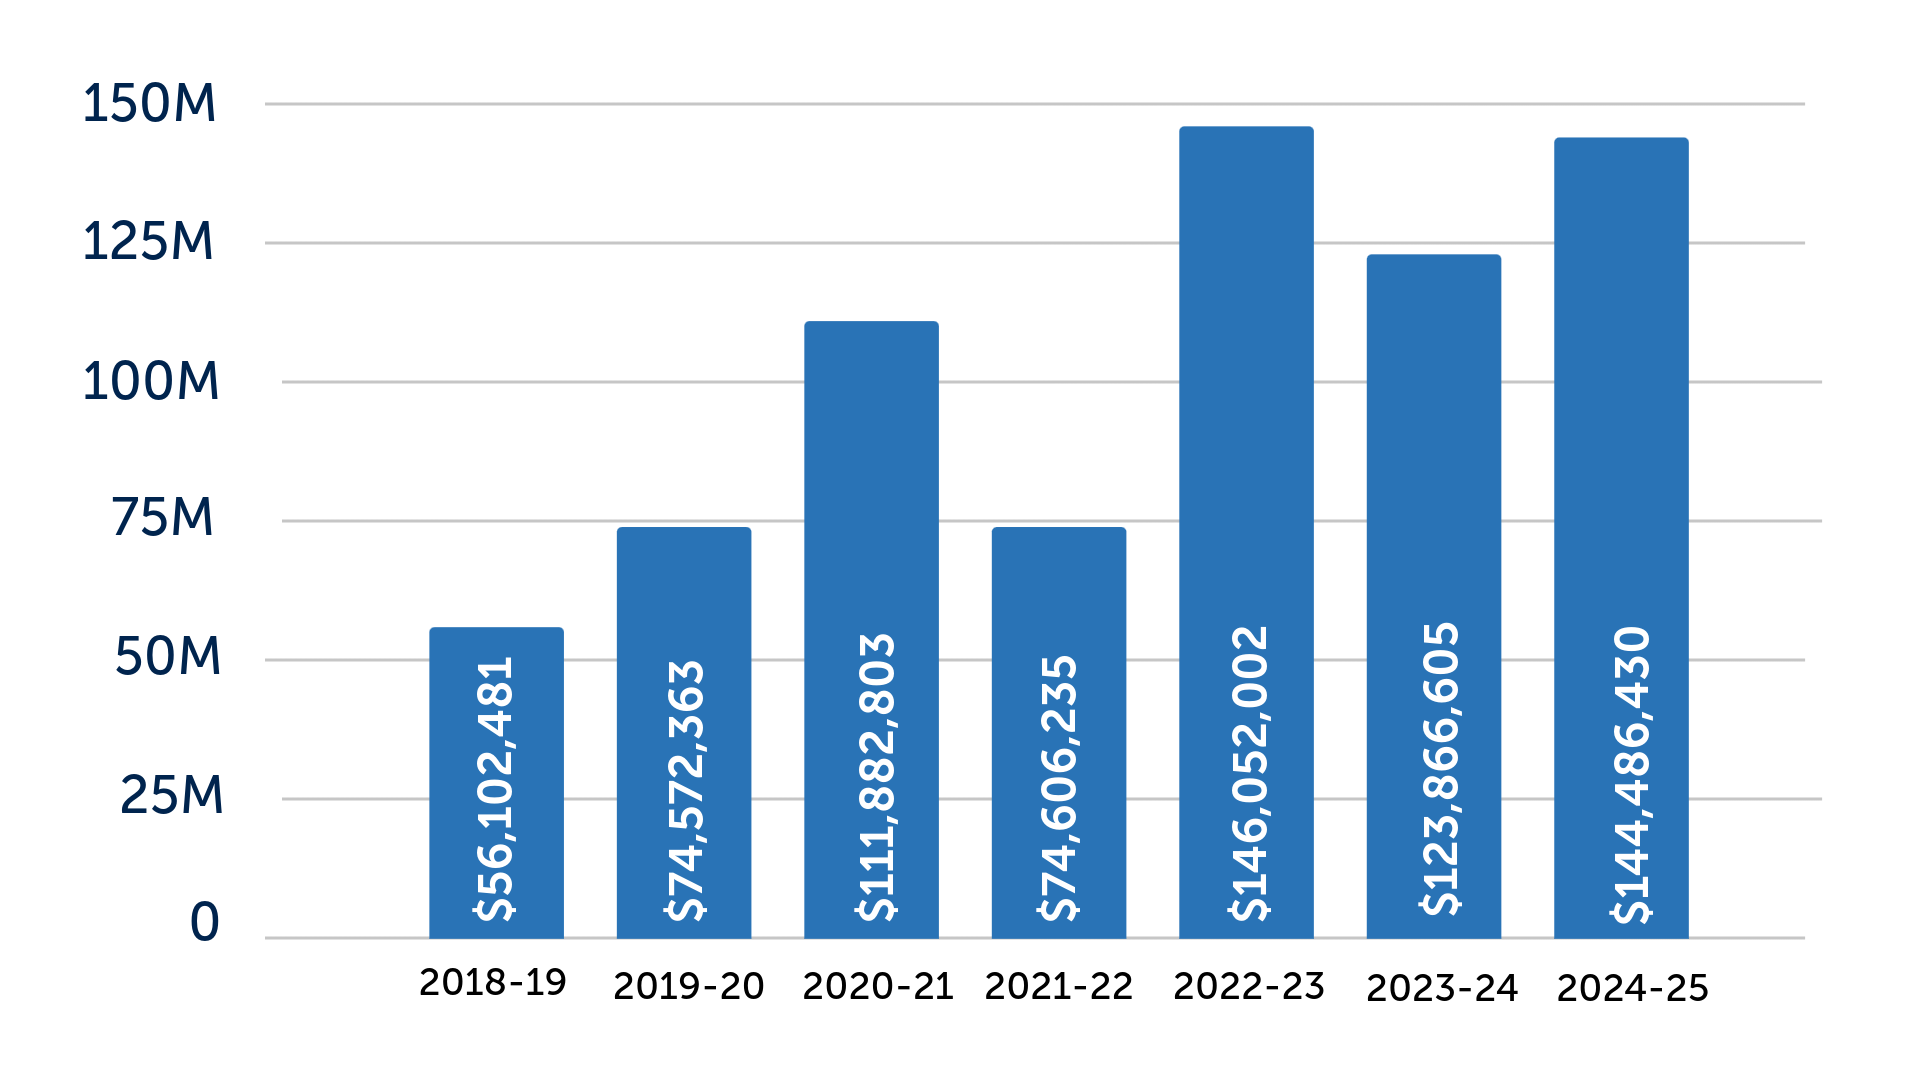 Multi-Year Submissions
2018 - 2019 | $56,102,481
2019-2020 | $74,572,363
2020 - 2021 | $111,882,803
2021 - 2022 | $74,606,235
2022 - 2023 | $146,052,002
2023 - 2024 | $123,866,605
2024 - 2025 | $144,486,430
Multi-Year Submissions by College/Division (since 2018)
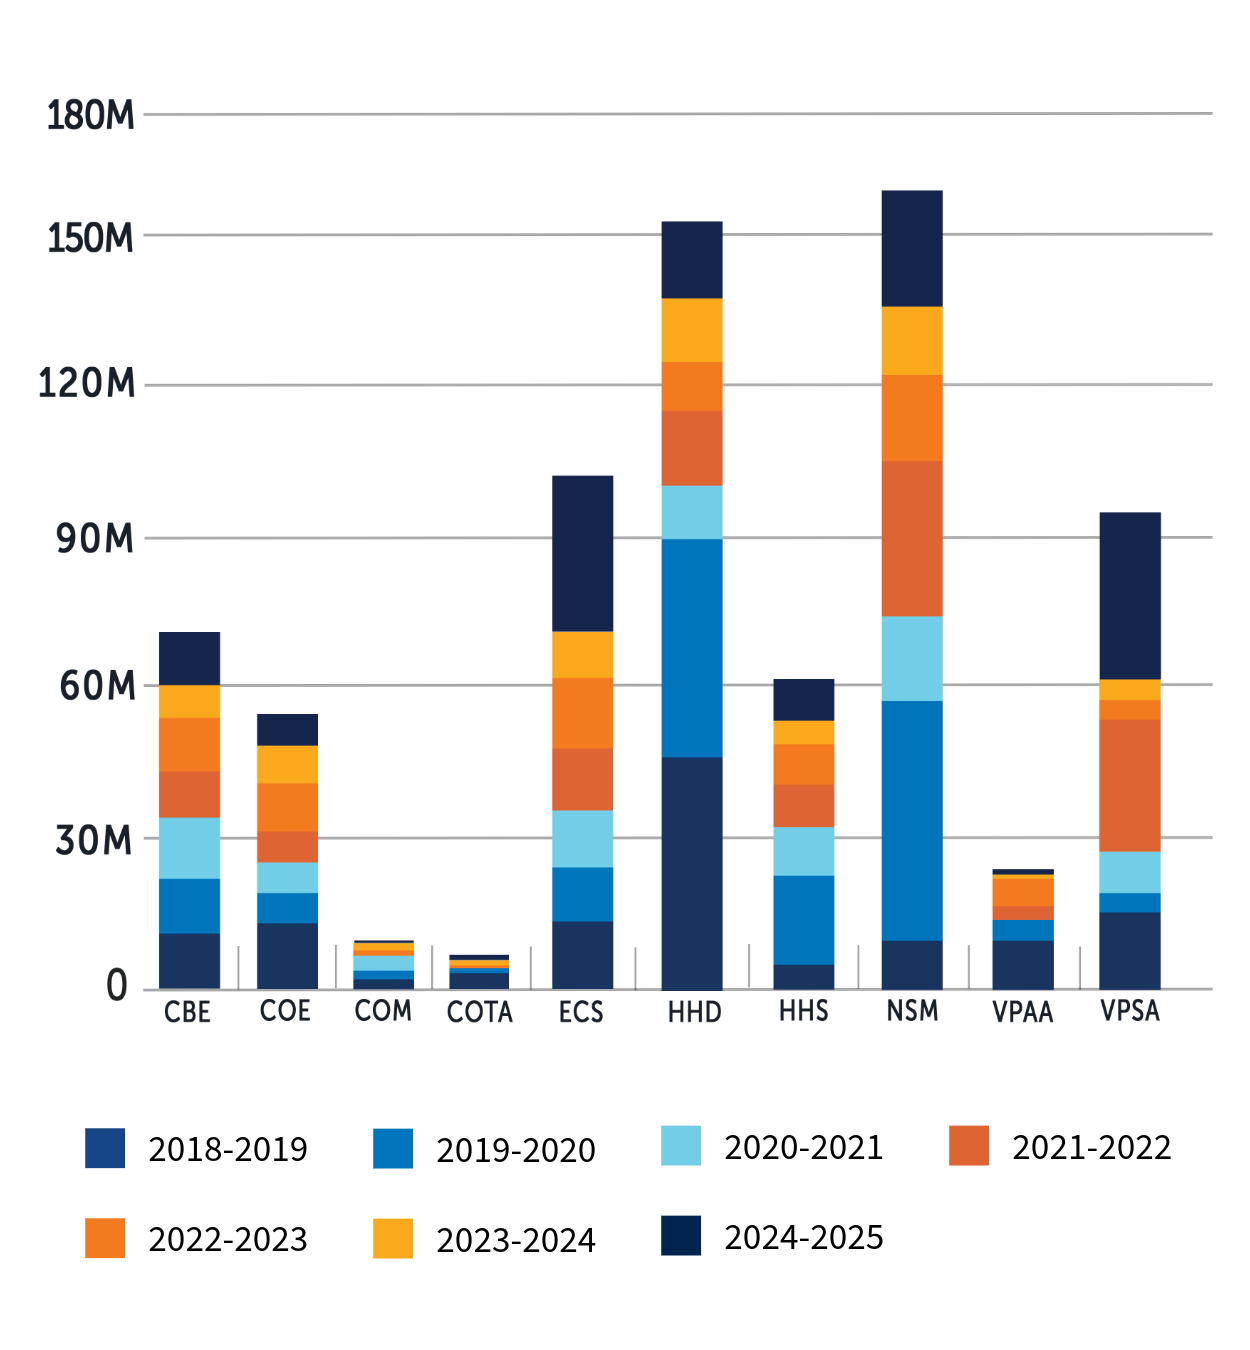
Seven Year Submission Totals by College/Division
CBE | $73,096,400
COE | $53,302,384
COMM | $6,088,244
COTA | $4,612,481
ECS | $99,724,911
HHD | $152,532,612
HSS | $61,676,101
NSM | $158,525,780
VPAA | $22,336,897
VPSA | $96,565,734
Intramural Grants by Program
 2024-2025 Intramural Grants by Program
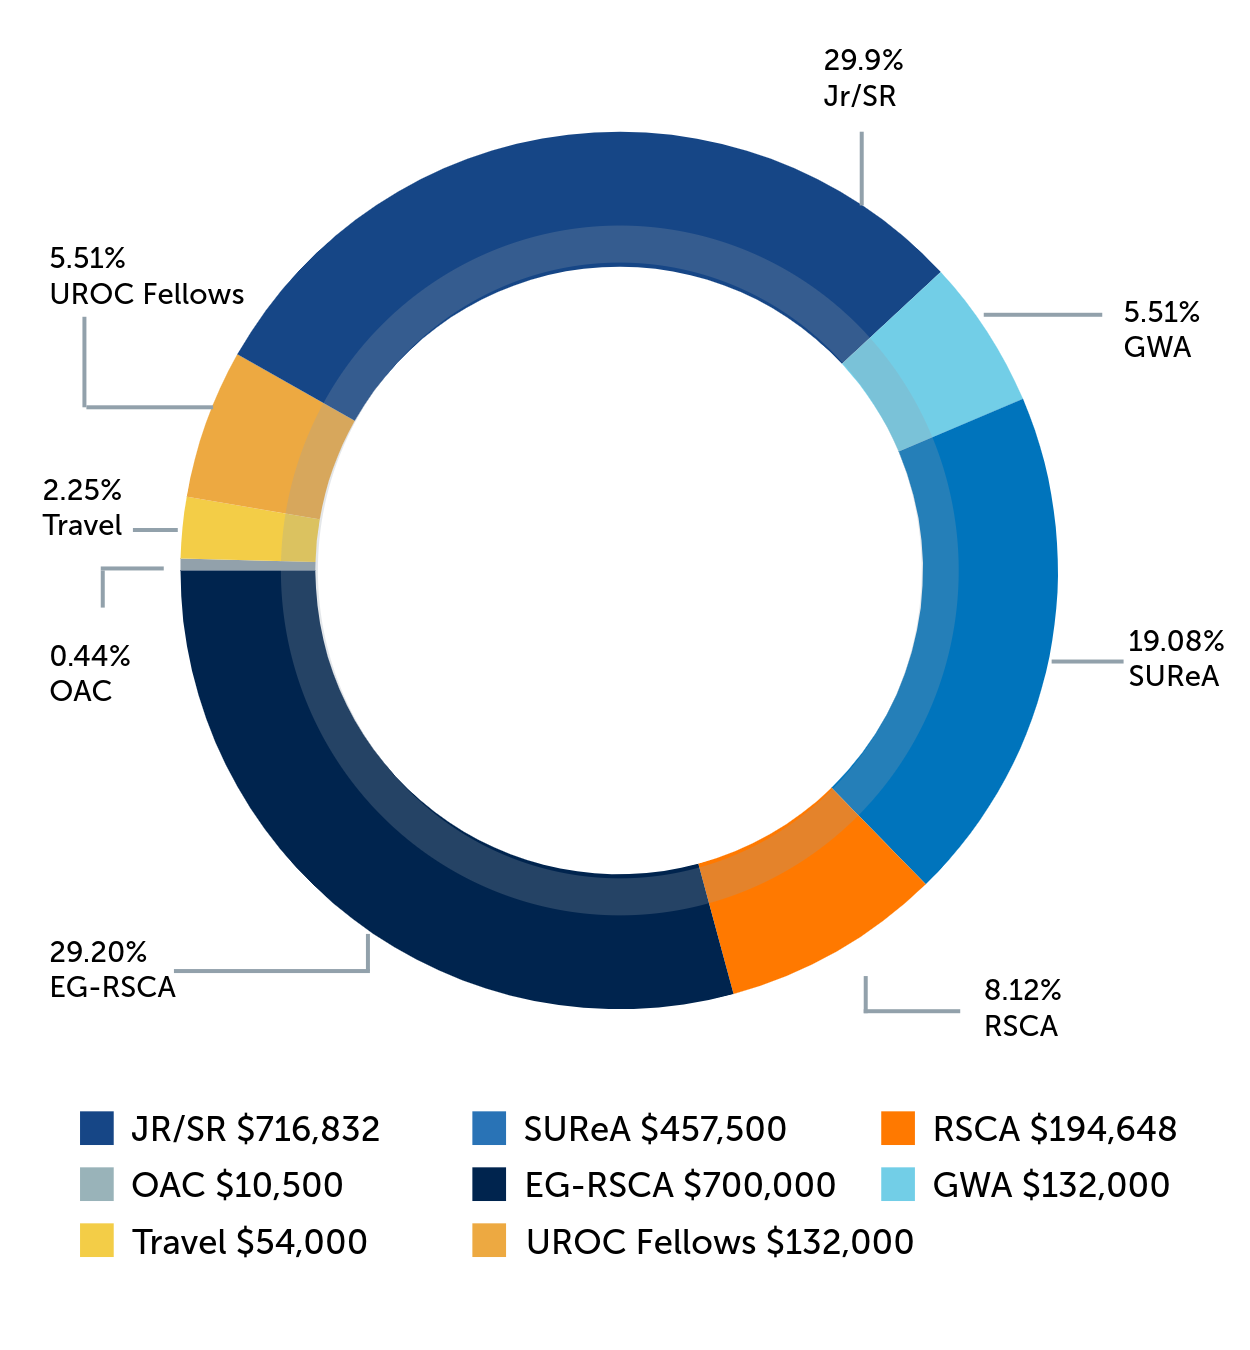
Jr/Sr | $716,823 (29.9%)
SUReA | $457,500 (19.08%)
RSCA | $194,648 (8.12%)
Travel | $54,000 (2.25%)
GWA | $132,000 (5.51%)
OAC | $10,500 (0.44%)
EG-RSCA | $700,000 (29.20%)
UROC Fellos | $132,000 (5.51%)
Multi-Year Intramural Grants
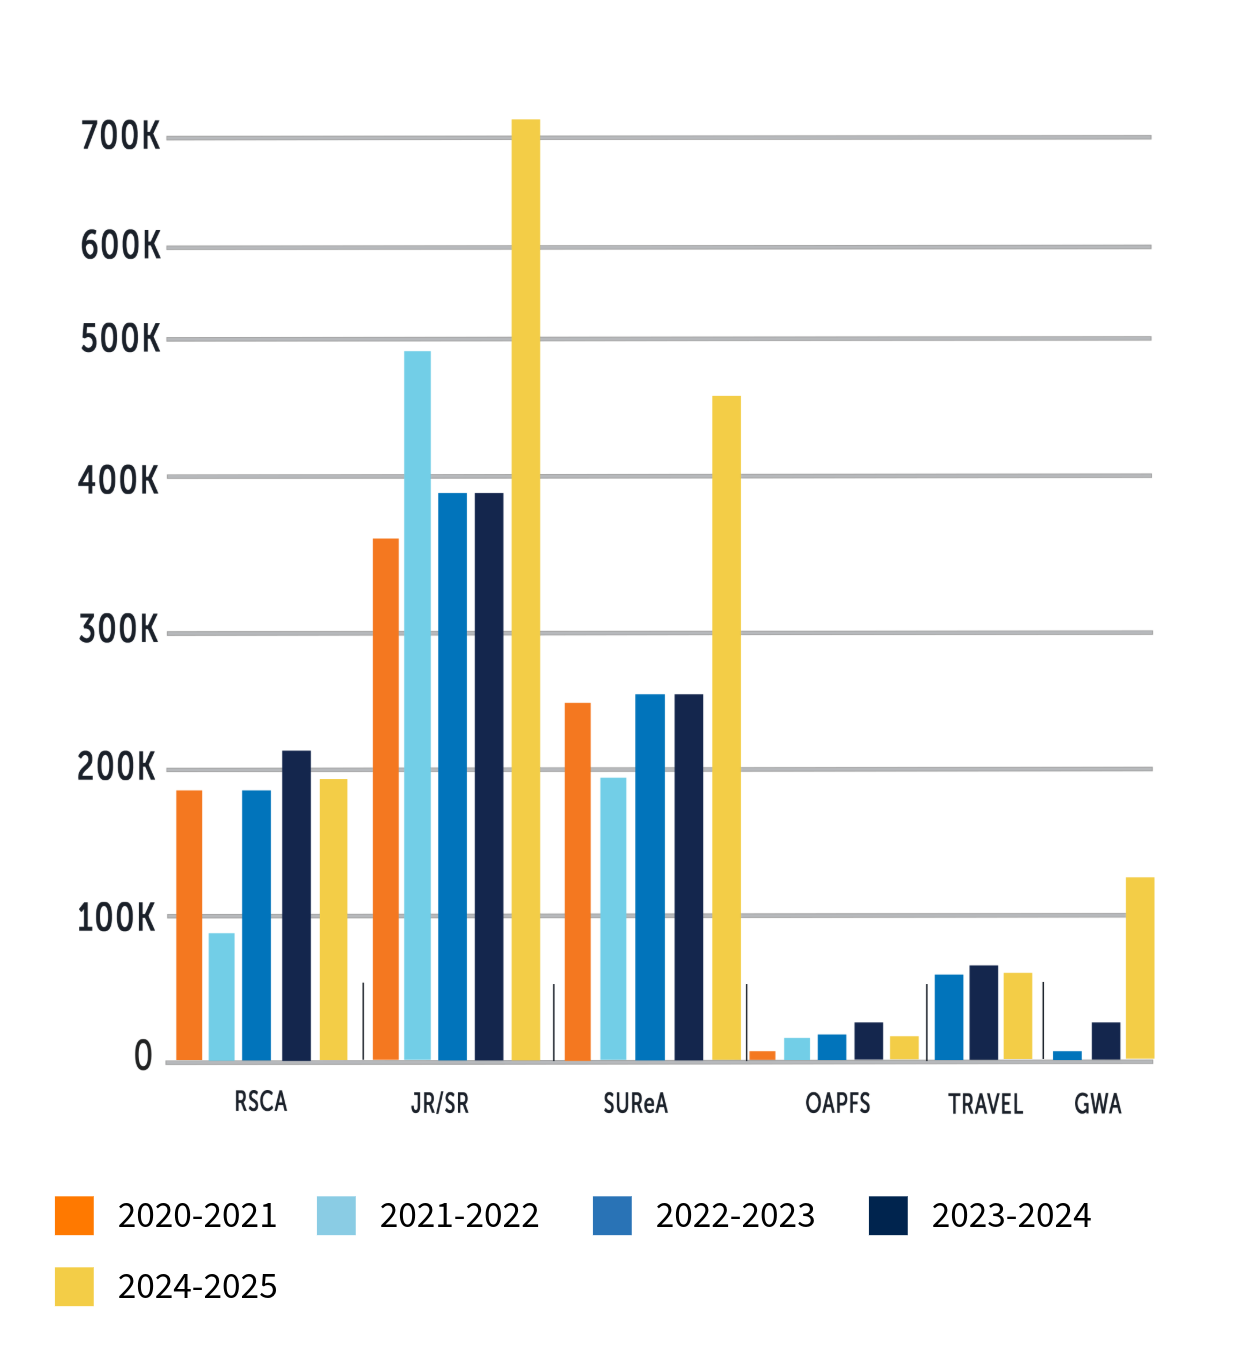
Intramural Grants since 2020
RSCA Grants
20-21 | $180,000
21-22 | $90,000
22-23 | $180,000
23-24 | $207,181
24-25 | $194,648
Jr/Sr Grants
20-21 | $356,150
21-22 | $488,458
22-23 | $381,067
23-24 | $383,503
24-25 | $716,823
SUReA
20-21 | $237,588
21-22 | $196,467
22-23 | $236,088
23-24 | $236,088
24-25 | $457,500
OAFP
20-21 | $9,000
21-22 | $13,500
22-23 | $15,000
23-24 | $18,000
24-25 | $10,500
Travel
22-23 | $53,000
23-24 | $55,000
24-25 | $54,000
Grant Writing Academy
22-23 | $6,000
23-24 | $35,000
24-25 | $132,000
IRB Submissions 2024-25
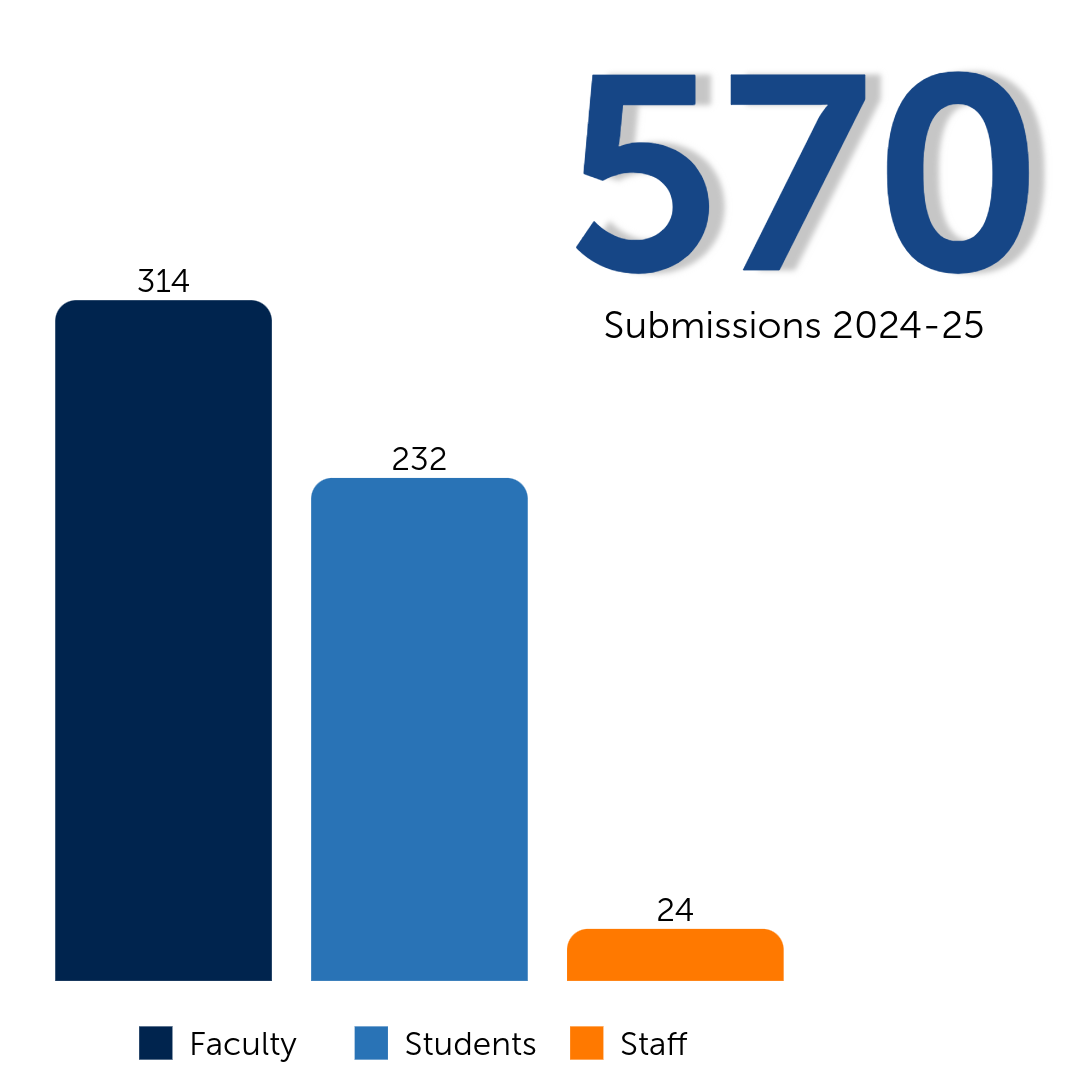
570 total submissions
Faculty - 314
Students - 232
Staff - 24
Student IRB Submittals
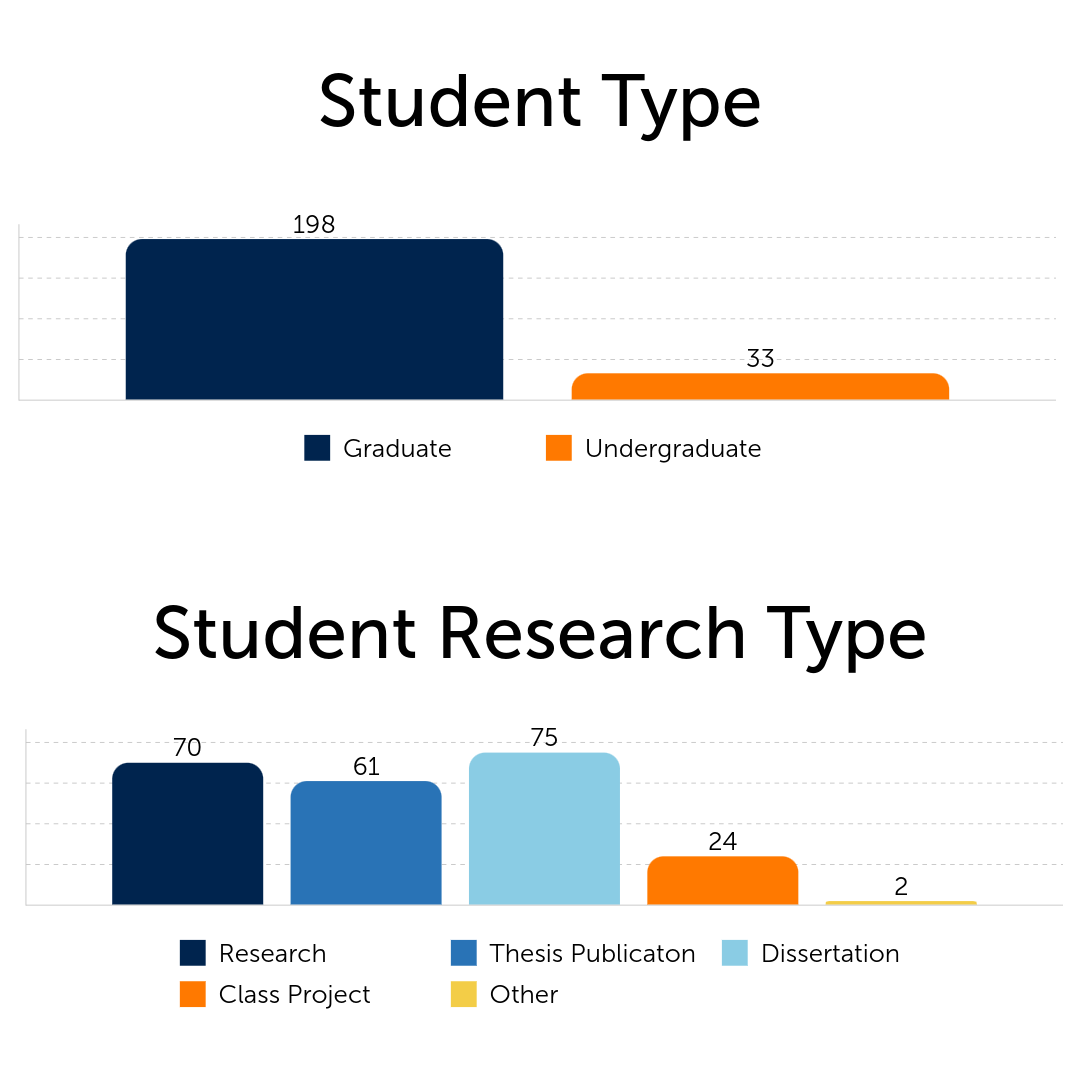
Student Type
Graduate - 199
Undergraduate - 33
Student Research Type
Research - 70
Thesis Publication - 61
Dissertation - 75
Class Project - 24
Other - 2
IRB Review Types
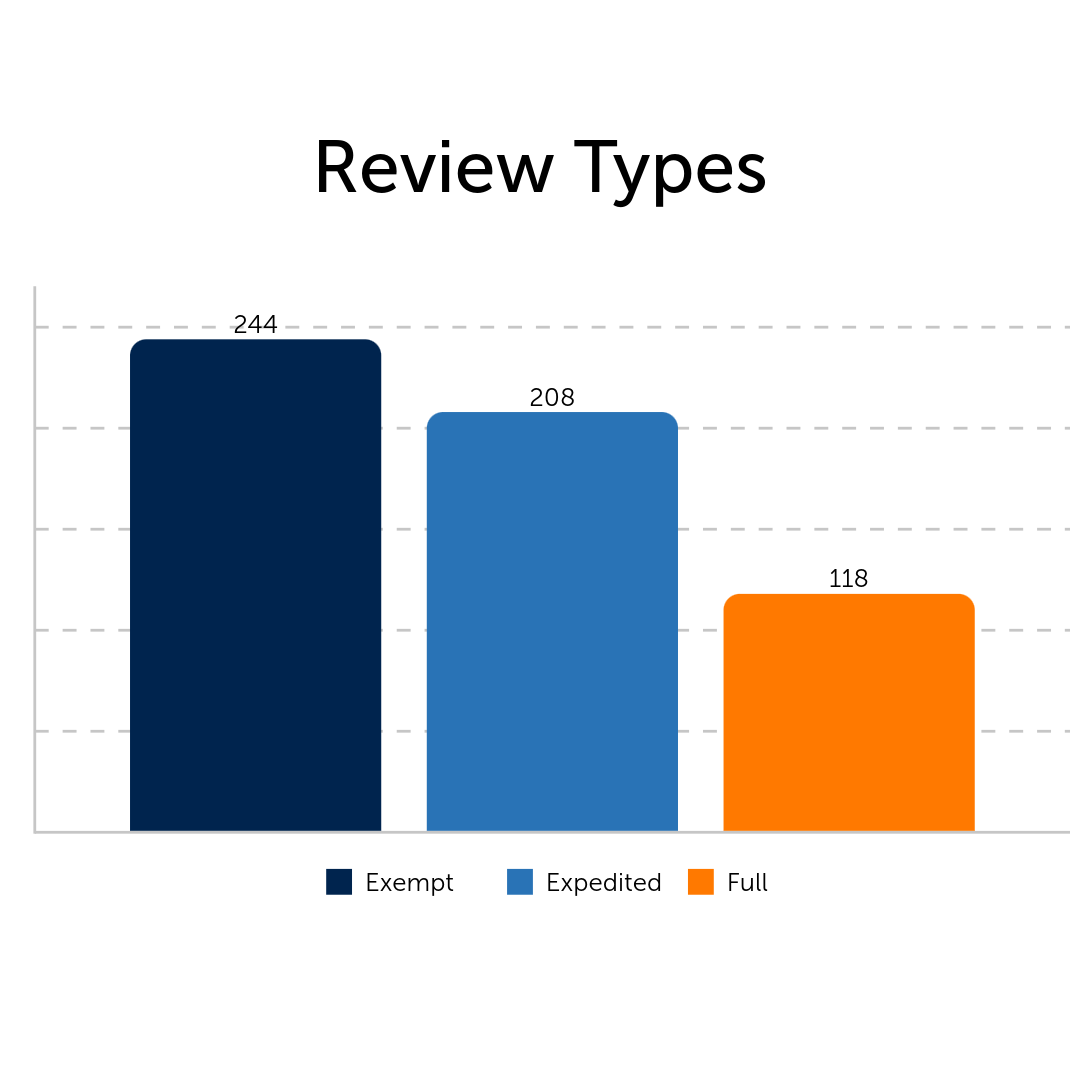
Exempt - 244
Expedited - 208
Full - 118
IACUC Submissions by Protocol
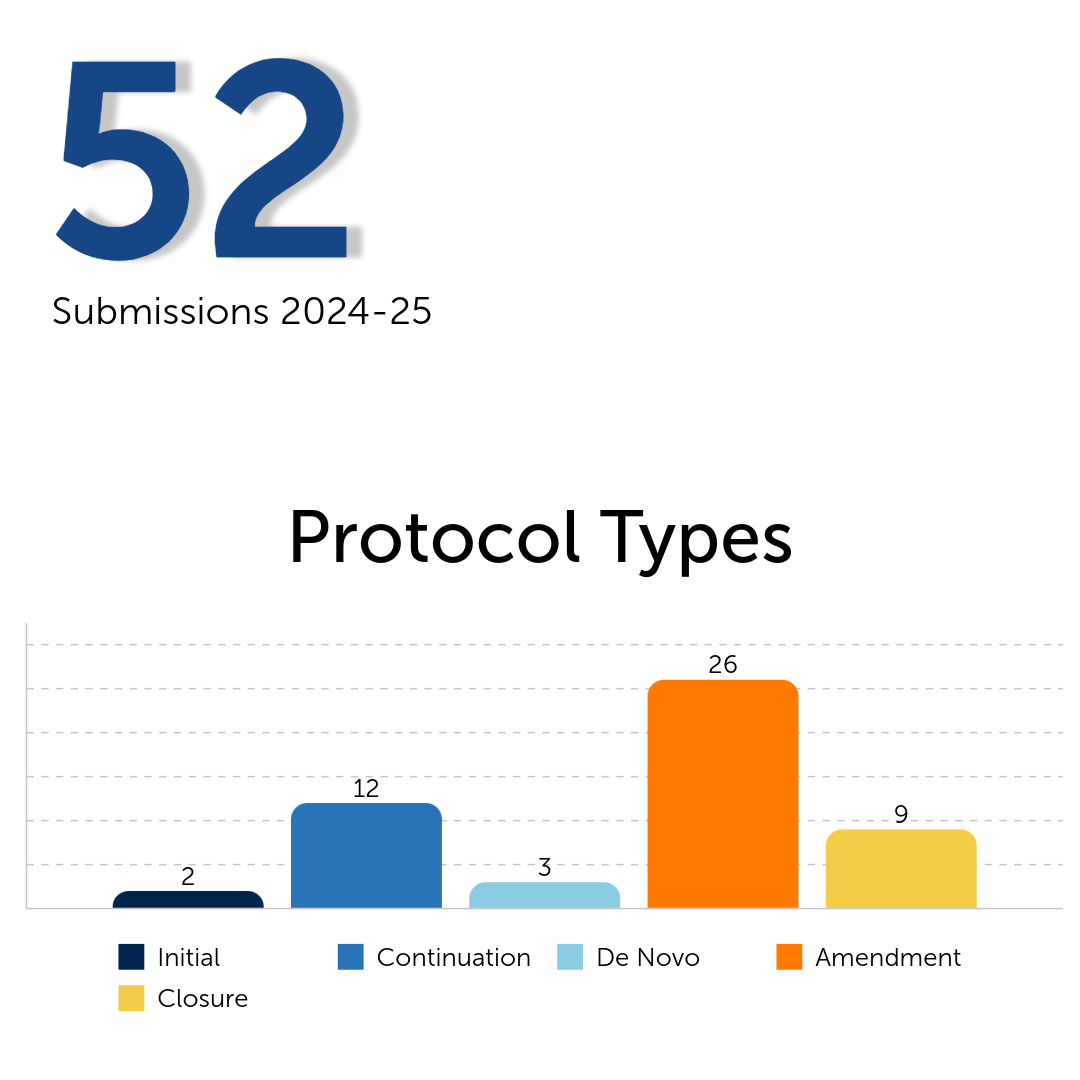 52 submissions (FY 24-25)
Initial - 2
Continuation - 12
De Novo - 3
Amendment - 26
Closure - 9
Breakdown by College
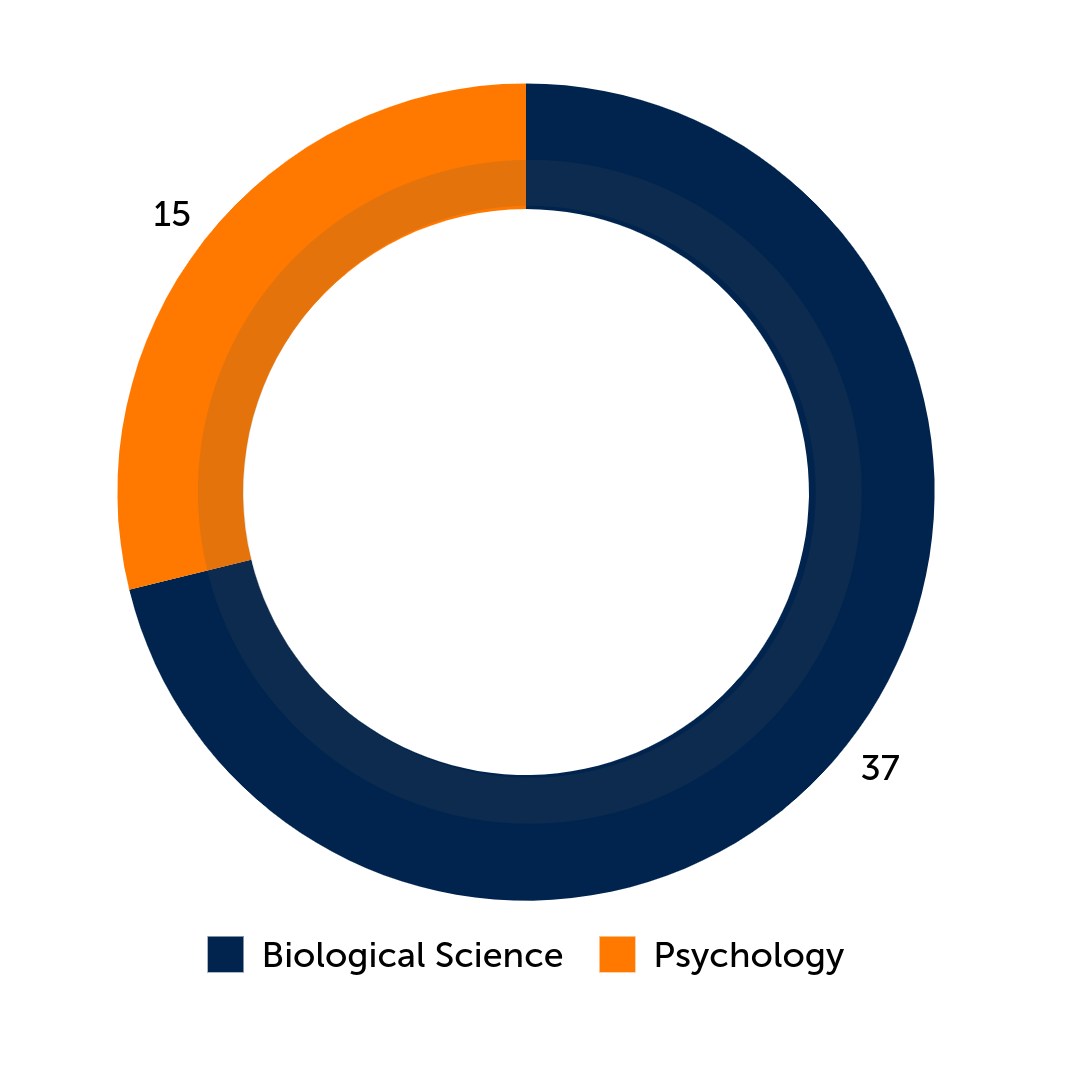
Biological Sciences - 37
Psychology - 15
Submissions by Protocol
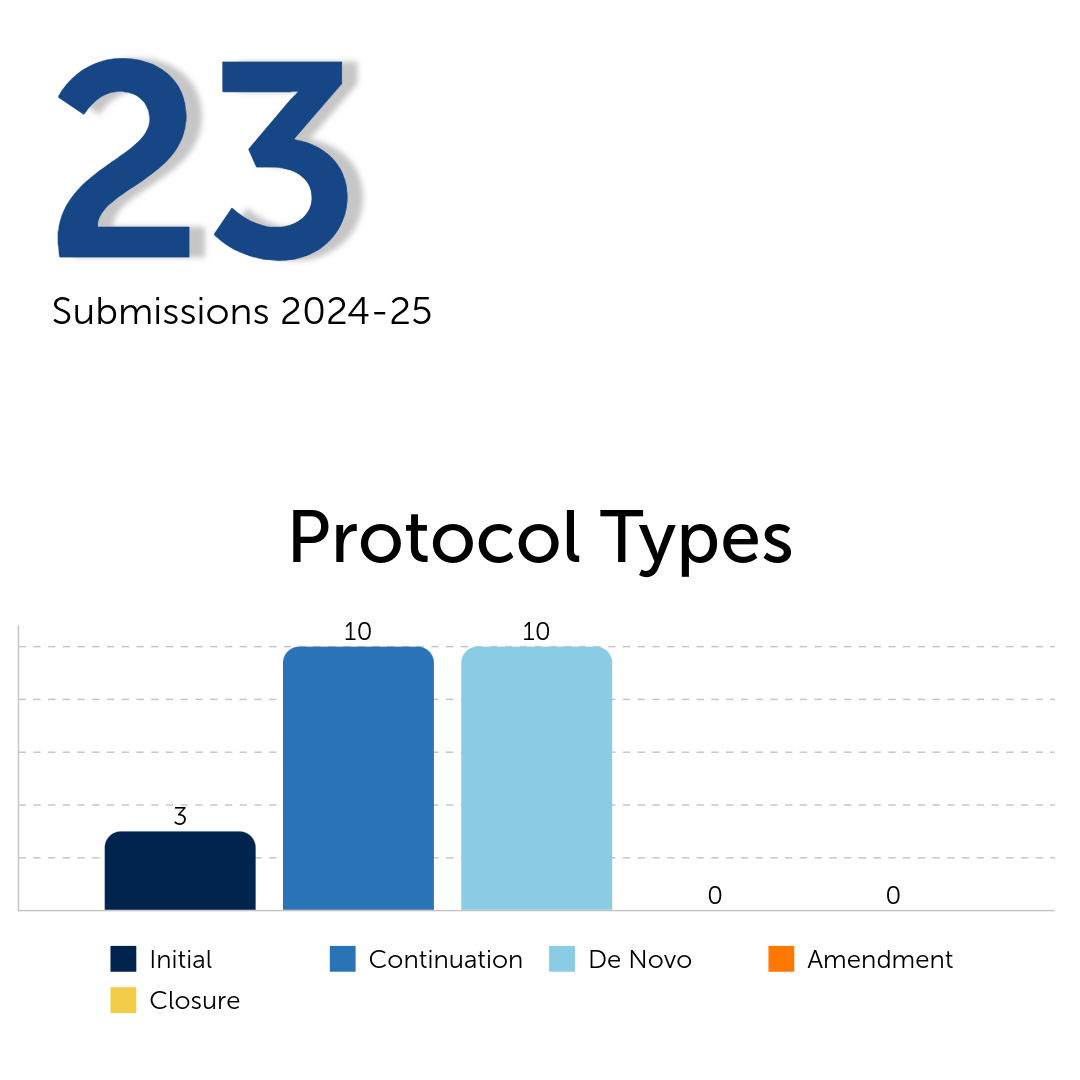
23 Submissions in '24-'25
Initial - 3
Continuation - 10
De Novo - 10
Amendment - 0
Closure - 0
Submissions by College
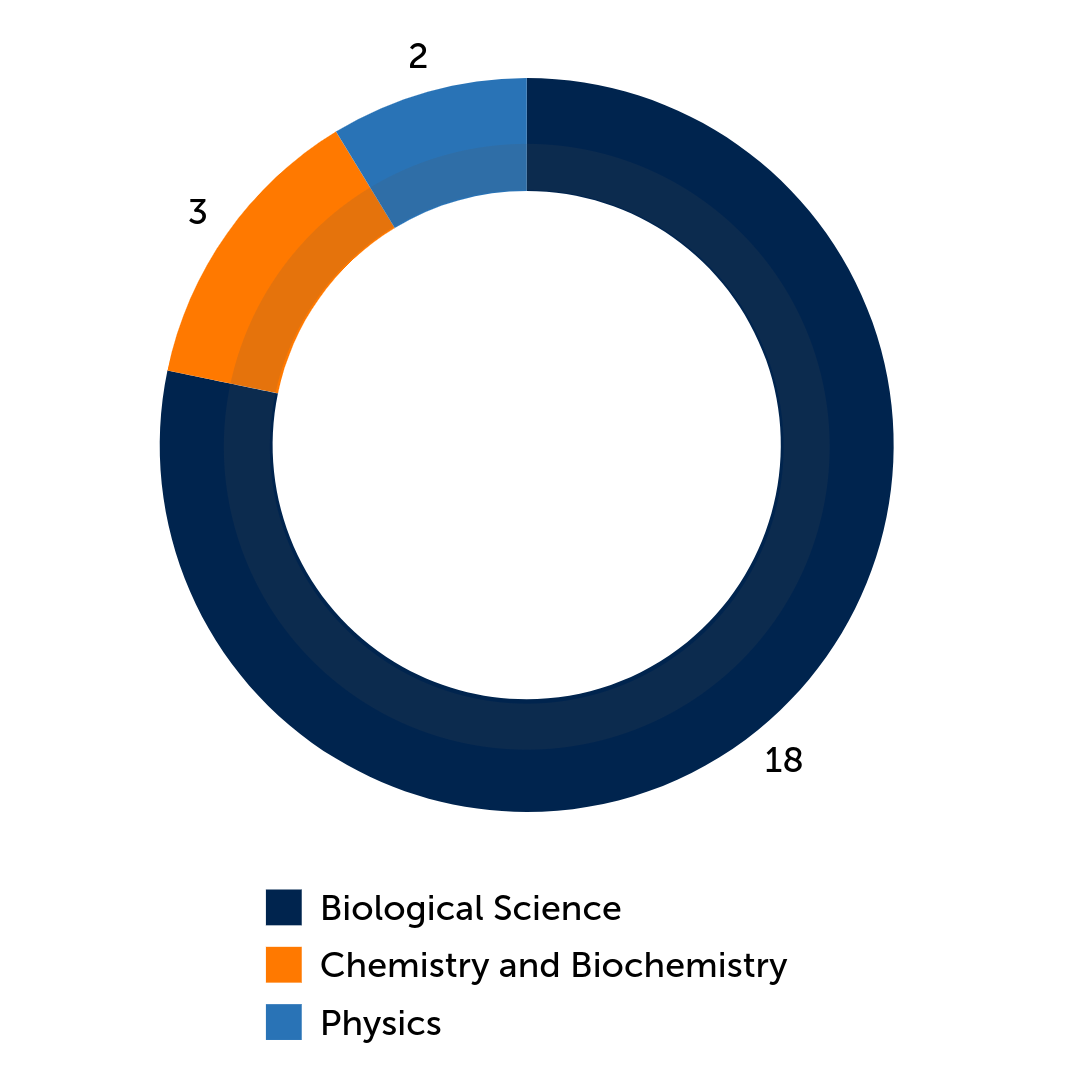 Biological Science - 18
Chemistry and Biochemistry - 3
Physics - 2